![]()
![]()
![]()
modelgraph#
A tool for visualizing dependencies between different components of your model.
Motivation#
Assume you have some model, represented as a system of ODEs with potentially several intermediation expression. For example in the classical Hodgkin Huxley model of the squid axon from 1952 we have the following expressions
dV_dt = -(-i_Stim + i_Na + i_K + i_L)/Cm
i_Na = g_Na*m**3*h*(V - E_Na)
From this we can deduce that i_Na depends on the parameter g_Na,
and since dV_dt depends on i_Na it also depends (indirectly) on
the parameter g_Na.
In modelgraph we can visualize this dependency using the following
code snippet
from modelgraph import DependencyGraph
import gotranx
# Load ode using gotran
ode = gotranx.load_ode("hodgkin_huxley_squid_axon_model_1952_original.ode")
# Build dependency graph
graph = DependencyGraph(ode)
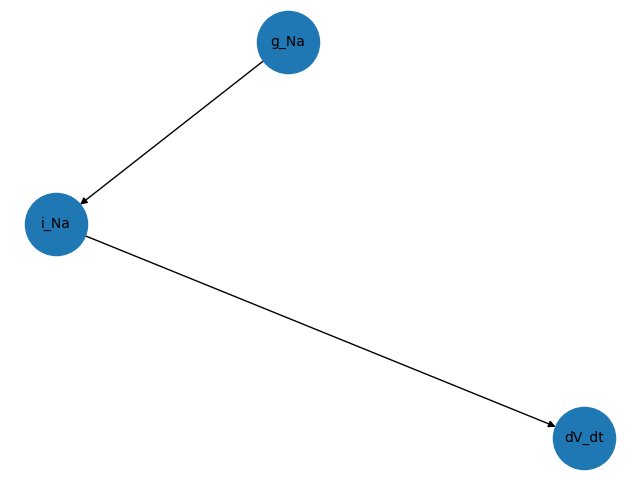
# Get the components that depends on g_Na (we call this inverse dependents)
G = graph.inv_dependency_graph("g_Na")
# Visualize using matplotlib (python -m pip install matplotlib)
import matplotlib.pyplot as plt
nx.draw(G, with_labels=True, font_size=10, node_size=2000)
plt.savefig("g_Na_mpl.png")
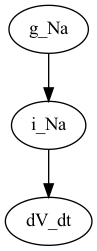
# Or using pydot (python -m pip install pydot)
P = nx.nx_pydot.to_pydot(G)
P.write_png("g_Na_pydot.png")
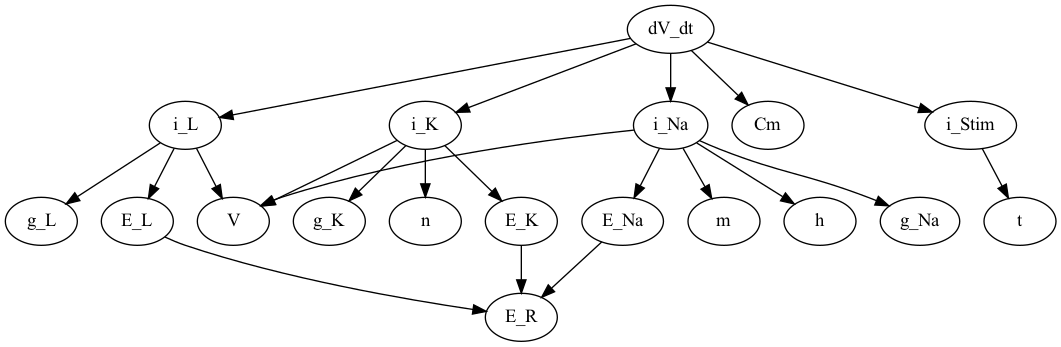
It is also possible to go the other way around, i.e if you want to look
at e.g dV_dt and see that it depends on
# Visualize what dV_dt depdens on
G_dV_dt = graph.dependency_graph("dV_dt")

nx.draw(G_dV_dt, with_labels=True, font_size=10, node_size=2000)
plt.savefig("dV_dt_mpl.png")

P_dV_dt = nx.nx_pydot.to_pydot(G_dV_dt)
P_dV_dt.write_png("dV_dt_pydot.png")
Here we only display the graph pydot since the matplotlib
version seems to be a bit messy if the graph becomes too large
Installation#
Install with pip
python3 -m pip install modelgraph
GUI#
There is also a graphical user interface. To use this you need to
install streamlit
python -m pip install streamlit
You can run the the gui by passing in the .ode file as a command
line argument e.g
python -m modelgraph demo/hodgkin_huxley_squid_axon_model_1952_original.ode
This will start a streamlit server, and the GUI is now hosted on
http://localhost:8501
Documentation#
Documentation is hosted at http://computationalphysiology.github.io/modelgraph.
Automated test#
Tests are provided in the folder tests. You can run the tests with pytest
python3 -m pytest tests -vv
Contributing#
License#
MIT
Contents: