Verification#
import dataset
import pprint
First we will load Dataset 1 from the paper. Her you have the option to either use the full resolution dataset or a dataset that is downsampled. To speed up computations you can use the downsampled dataset
full_resolution = False
data = dataset.load_sample_data(full_resolution=full_resolution)
pprint.pprint(data.info)
{'dt': 25.004229346742502,
 'num_frames': 236,
 'size_x': 613,
 'size_y': 145,
 'time_unit': 'ms',
 'um_per_pixel': 1.08615103979884}
We can now extract the first frame from the dataset which will be used in the verification.
frame = data.frames[:, :, 0].T
frame
array([[35754, 36999, 39521, ..., 27215, 22756, 27350],
       [36789, 37563, 40376, ..., 27309, 22721, 26453],
       [38119, 38877, 41162, ..., 27115, 22545, 27679],
       ...,
       [42218, 43225, 40372, ..., 16339, 15880, 16158],
       [38348, 40989, 38138, ..., 16571, 16318, 15839],
       [38603, 40368, 38705, ..., 19332, 18579, 17934]], dtype=uint16)
As we can see, the frame is just a regular numpy array with 16 bit unsigned integers.
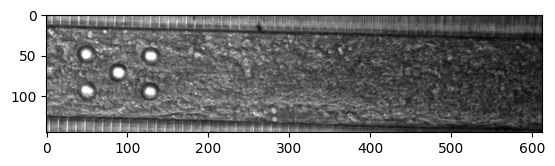
Now let us plot the first frame
import matplotlib.pyplot as plt
plt.imshow(frame, cmap='gray')
<matplotlib.image.AxesImage at 0x7f1190fb6b60>
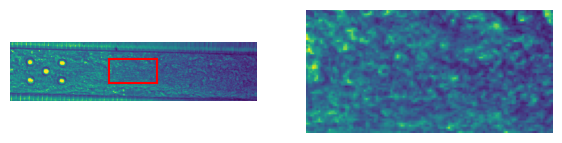
For the verification we will only use a small region of the frame which we can plot as follows
def extract_region(frame, full_resolution):
    offset = 100 if full_resolution else 30
    n1, n2 = frame.shape
    x1 = n1 // 2 - offset
    x2 = n1 // 2 + offset
    y1 = n2 // 2 - 2 * offset
    y2 = n2 // 2 + 2 * offset
    return frame[x1:x2, y1:y2]

def plot_frame_with_region(frame, full_resolution):
    offset = 100 if full_resolution else 30


    fig, ax = plt.subplots(1, 2, figsize=(7, 2))
    ax[0].imshow(frame)

    n1, n2 = frame.shape
    x1 = n1 // 2 - offset
    x2 = n1 // 2 + offset
    y1 = n2 // 2 - 2 * offset
    y2 = n2 // 2 + 2 * offset
    ax[0].plot([y1, y2], [x1, x1], "r")
    ax[0].plot([y1, y2], [x2, x2], "r")
    ax[0].plot([y1, y1], [x1, x2], "r")
    ax[0].plot([y2, y2], [x1, x2], "r")
    ax[1].imshow(frame[x1:x2, y1:y2])
    for axi in ax:
        axi.axis("off")
    plt.show()

plot_frame_with_region(frame, full_resolution)
region = extract_region(frame, full_resolution)
region
array([[26974, 27902, 31512, ..., 47756, 44681, 34804],
       [28237, 28702, 27581, ..., 47156, 46218, 36131],
       [28955, 28350, 28022, ..., 52517, 47131, 43947],
       ...,
       [32777, 34007, 32224, ..., 29435, 29171, 30942],
       [36765, 33816, 30995, ..., 30707, 33817, 34103],
       [43151, 39674, 35979, ..., 34079, 32265, 32381]], dtype=uint16)
We will now go ahead and run the verification using a synthetic function. First we will import some necessary libraries, including mps-motion
from pathlib import Path
from mps_motion import farneback, lucas_kanade, block_matching, dualtvl1
import dask.array as da
from scipy.ndimage import geometric_transform
import numpy as np
import time
import json
Now we will define the synthetic function which is
def get_func(a=0.001, b=0):
    def func(x):
        return (x[0] * (1 - a), x[1] * (1 - b))

    return func
We will use the parameters \((a, b) \in \{ (0.005, 0.0), (0.0, 0.007), (0.005, 0.007) \}\), so we put those into a dictionary
displacement_parameters = {
    "x": {"a": 0.005, "b": 0.0},
    "y": {"a": 0.0, "b": 0.007},
    "xy": {"a": 0.005, "b": 0.007},
}
Now we create new directory where we will store the results
results = Path("results") / "verification"
results.mkdir(exist_ok=True, parents=True)
And then we run the 10 times and code keep the average time
timings = {}
N = 10

for flow, name, kwargs in [
    (farneback.flow, "farneback", {}),
    (lucas_kanade.flow, "lucas_kanade", {}),
    (block_matching.flow, "block_matching", {}),
    (dualtvl1.flow, "dualtvl1", {}),
]:

    print(name)
    timings[name] = {}
    for direction in ["x", "y", "xy"]:
        path = results / f"{direction}_displacement_{name}.npy"
        a = displacement_parameters[direction]["a"]
        b = displacement_parameters[direction]["b"]
        print(f"{direction} displacement")

        frame2 = geometric_transform(region.T, get_func(a, b)).T

        t0 = time.perf_counter()
        for _ in range(N):
            u = flow(frame2, region, **kwargs)
        timings[name][direction] = (time.perf_counter() - t0) / N

        if isinstance(u, da.Array):
            u = u.compute()
        np.save(path, u)
    path.with_name("timings").with_suffix(".json").write_text(json.dumps(timings))
farneback
x displacement
y displacement
xy displacement
lucas_kanade
x displacement
y displacement
xy displacement
block_matching
x displacement
y displacement
xy displacement
dualtvl1
x displacement
y displacement
xy displacement
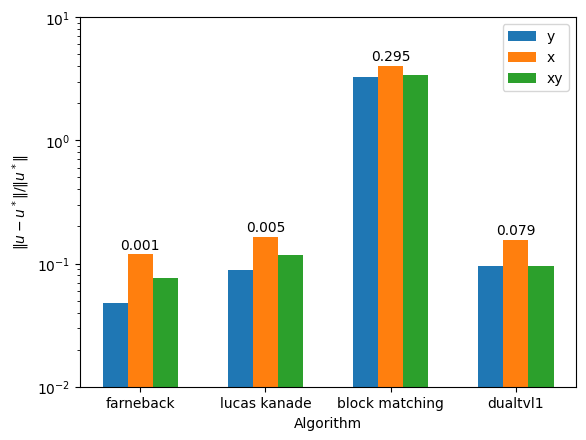
Now we will plot the timings and errors
algs = ["farneback", "lucas_kanade", "block_matching", "dualtvl1"]
cases = ["x", "y", "xy"]
path = results / "timings.json"
timings = json.loads(path.read_text())
x, y = np.meshgrid(np.arange(region.shape[1]), np.arange(region.shape[0]))

all_errors = []

for i, alg in enumerate(algs):
    errs = []
    for j, disp in enumerate(cases):
        U = np.load(results / f"{disp}_displacement_{alg}.npy")
        u = U[:, :, 0]
        v = U[:, :, 1]

        a = displacement_parameters[disp]["a"]
        b = displacement_parameters[disp]["b"]

        func = get_func(a, b)
        u0, v0 = func([x, y])
        u_exact = x - u0
        v_exact = y - v0
        errs.append(
            np.linalg.norm([u - u_exact, v - v_exact])
            / np.linalg.norm([u_exact, v_exact])
        )
    all_errors.append(errs)

all_errors = np.array(all_errors)
width = 0.2
x = np.arange(len(algs))
fig, ax = plt.subplots()
rectsy = ax.bar(
    x - width,
    all_errors.T[0],
    width=width,
    align="center",
    label="y",
)
rectsx = ax.bar(
    x,
    all_errors.T[1],
    width=width,
    align="center",
    label="x",
)
rectsxy = ax.bar(
    x + width,
    all_errors.T[2],
    width=width,
    align="center",
    label="xy",
)
ax.set_xticks(x)
ax.set_xticklabels([" ".join(alg.split("_")) for alg in algs])  # , rotation=30)
ax.legend()
ax.set_xlabel("Algorithm")
ax.set_yscale("log")
ax.set_ylabel(r"$\| u - u^* \| / \| u^* \|$")

for label, rects in [("x", rectsx)]:  # , ("y", rectsy), ("xy", rectsxy)]:
    for text, rect in zip([timings[alg][label] for alg in algs], rects):
        height = rect.get_height()
        ax.text(
            rect.get_x() + rect.get_width() / 2.0,
            1.05 * height,
            f"{text:.3f}",
            ha="center",
            va="bottom",
        )
ax.set_ylim(1e-2, 10)
(0.01, 10)
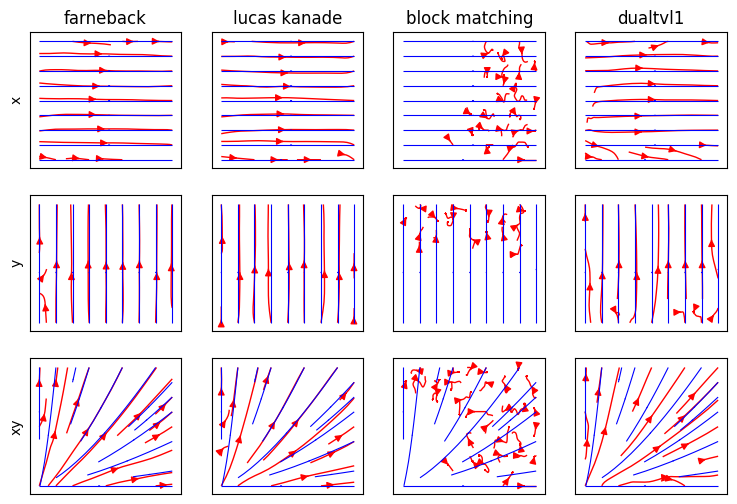
And finally the resulting motion vectors
fig, ax = plt.subplots(3, 4, figsize=(9, 6), sharex=True, sharey=True)

algs = ["farneback", "lucas_kanade", "block_matching", "dualtvl1"]

x, y = np.meshgrid(np.arange(region.shape[1]), np.arange(region.shape[0]))
for i, alg in enumerate(algs):

    for j, disp in enumerate(["x", "y", "xy"]):
        U = np.load(results / f"{disp}_displacement_{alg}.npy")
        u = U[:, :, 0]
        v = U[:, :, 1]

        a = displacement_parameters[disp]["a"]
        b = displacement_parameters[disp]["b"]

        func = get_func(a, b)
        u0, v0 = func([x, y])

        axi = ax[j, i]
        axi.streamplot(
            x,
            y,
            u,
            v,
            color="r",
            density=0.3,
            linewidth=1.0,
            arrowstyle="-|>",
        )

        axi.streamplot(
            x,
            y,
            x - u0,
            y - v0,
            color="b",
            density=0.3,
            linewidth=0.8,
            arrowstyle="-",
        )

        if i == 0:
            axi.set_ylabel(disp)
        if j == 0:
            axi.set_title(" ".join(alg.split("_")))
        axi.set_xticks([])
        axi.set_yticks([])