Optimizing for Pulmonary Hypertension (Disease Modeling)#
This demo shows how to take the Healthy Baseline model (which is the default) and evolve it into a Pulmonary Hypertension (PH) disease state.
For a detailed explanation of the optimization strategy and the core physics of the model, please refer to the Healthy Baseline Optimization script.
Pathophysiology: The Disease State#
Pulmonary Hypertension is defined by a specific set of mechanical failures and biological compensations.
The primary defect is a massive increase in Pulmonary Resistance and a decrease in Arterial Compliance (stiffening). The vessels in the lungs narrow, making it hard to push blood through.
In response, the Right Ventricle (RV) remodels. It undergoes Hypertrophy, becoming thicker and stiffer. This increases its Contractility (\(E_{max}\)) to overcome the pressure, but also increases its Passive Stiffness (\(E_{min}\)), possibly leading to diastolic dysfunction.
The Optimization Goal#
We want to find a parameter set that produces the following hemodynamic profile:
RV Systolic Pressure: ~60 mmHg (Normal is ~25). This is the hallmark of the disease.
RV End-Diastolic Pressure: ~10 mmHg (Normal is ~4). Elevated due to the stiff hypertrophic wall.
Stroke Volume: ~60 mL. Slightly reduced from the healthy 70 mL due to the high afterload.
LV Filling: Impaired. The LV is healthy, but it receives less blood because the RV cannot pump effectively through the lungs.
Target PH Hemodynamics:
  RV_ESP: 60.0
  RV_EDP: 10.0
  LV_ESP: 110.0
  LV_EDP: 8.0
  SV: 60.0
  Ao_DBP: 75.0
Configuration: From Healthy to Disease#
We start with the Healthy Defaults. In our configuration below, we use the healthy parameter values as the “Scale Factor”.
This means an optimizer value of 1.0 represents a Healthy patient. An optimizer value of 5.0 represents a 5-fold increase in that parameter (e.g., 5x Resistance). This makes the disease progression easy to interpret.
class PHModelInterface:
    def __init__(self):
        # Start with the HEALTHY defaults
        self.base_model = Regazzoni2020(add_units=False)
        self.base_params = self.base_model.parameters
        self.base_init = self.base_model._initial_state

        # Configuration: (Parameter Name, Initial Guess, Lower Bound, Upper Bound, Scale Factor)
        # Scale Factor = Default Healthy Value.
        self.config = [
            # The Root Cause: Pulmonary Vasculature
            # Resistance must increase drastically (e.g., 10x healthy)
            ("circulation.PUL.R_AR",    5.0,    1.0,   20.0,  self.base_params["circulation"]["PUL"]["R_AR"]),
            # Compliance drops (stiff vessels)
            ("circulation.PUL.C_AR",    0.5,    0.1,   1.0,   self.base_params["circulation"]["PUL"]["C_AR"]),

            # The Compensation: RV Remodeling
            # RV contracts harder (Higher EA) to overcome resistance
            ("chambers.RV.EA",          2.0,    1.0,   10.0,  self.base_params["chambers"]["RV"]["EA"]),
            # RV wall thickens, becoming stiffer (Higher EB)
            ("chambers.RV.EB",          2.0,    1.0,   10.0,  self.base_params["chambers"]["RV"]["EB"]),

            # Systemic Compensation
            # Systemic resistance increases slightly (sympathetic response) to maintain BP
            ("circulation.SYS.R_AR",    1.1,    0.8,   2.0,   self.base_params["circulation"]["SYS"]["R_AR"]),

            # Volume Status
            # PH patients often have fluid retention (congestion).
            ("TOTAL_VOLUME_OFFSET",     0.0,   -200.0, 1000.0, 100.0)
        ]

    def get_initial_guess(self):
        return [val for _, val, _, _, _ in self.config]

    def get_bounds(self):
        return [(lb, ub) for _, _, lb, ub, _ in self.config]

    def update_model(self, scaled_x):
        params = self.base_params.copy()
        init_state = self.base_init.copy()

        for val, (key, _, _, _, scale) in zip(scaled_x, self.config):
            real_val = val * scale

            if key == "TOTAL_VOLUME_OFFSET":
                # Volume Injection Logic
                C_ven = params["circulation"]["SYS"]["C_VEN"]
                current_p = init_state["p_VEN_SYS"]
                if hasattr(current_p, "magnitude"): current_p = current_p.magnitude

                # real_val is mL of blood added
                init_state["p_VEN_SYS"] = current_p + (real_val / C_ven)
            else:
                # Standard parameter update
                keys = key.split(".")
                d = params
                for k in keys[:-1]:
                    d = d[k]
                d[keys[-1]] = real_val

        return params, init_state
The Cost Function#
We prioritize the RV targets (Pressure and Filling) because those define the disease phenotype. We apply a lower weight to the Left Ventricle targets, allowing them to shift naturally as a secondary consequence of the right-sided failure.
interface = PHModelInterface()
iteration_counter = [0]

def cost_function(scaled_x):
    params, init_state = interface.update_model(scaled_x)

    # Silence logger inside the function as Model() resets it
    logging.getLogger('circulation.base').setLevel(logging.WARNING)

    model = Regazzoni2020(parameters=params, initial_state=init_state, add_units=False, verbose=False)
    try:
        history = model.solve(num_beats=10, dt=2e-3)
    except (RuntimeError, ValueError):
        return 1e6

    # Metrics
    samples = int((1/params["HR"]) / 2e-3)
    slc = slice(-samples, None)

    p_rv = history["p_RV"][slc]
    v_rv = history["V_RV"][slc]
    p_lv = history["p_LV"][slc]
    p_ao = history["p_AR_SYS"][slc]

    if np.max(p_rv) > 300.0 or np.isnan(np.sum(p_rv)):
        return 1e6

    metrics = {
        "RV_ESP": np.max(p_rv),
        "RV_EDP": np.min(p_rv),
        "SV":     np.max(v_rv) - np.min(v_rv),
        "LV_ESP": np.max(p_lv),
        "LV_EDP": np.min(p_lv),
        "Ao_DBP": np.min(p_ao)
    }

    cost = 0.0

    # Primary Targets (The Disease)
    # RV Pressure must be high (Weight: 50)
    cost += 50.0 * ((metrics["RV_ESP"] - targets["RV_ESP"]) / targets["RV_ESP"])**2
    # RV Filling Pressure (Weight: 20)
    cost += 20.0 * ((metrics["RV_EDP"] - targets["RV_EDP"]) / targets["RV_EDP"])**2
    # Stroke Volume (Weight: 20)
    cost += 20.0 * ((metrics["SV"] - targets["SV"]) / targets["SV"])**2

    # Secondary Targets (Systemic Stability)
    cost += 5.0 * ((metrics["LV_ESP"] - targets["LV_ESP"]) / targets["LV_ESP"])**2
    cost += 5.0 * ((metrics["Ao_DBP"] - targets["Ao_DBP"]) / targets["Ao_DBP"])**2

    # Logging
    if iteration_counter[0] % 10 == 0:
        print(f"Iter {iteration_counter[0]:3d} | Cost: {cost:.4f} | SV: {metrics['SV']:.1f}")
        print(f"    RV: {metrics['RV_ESP']:.0f}/{metrics['RV_EDP']:.0f} mmHg (Target 60/10)")

    iteration_counter[0] += 1
    return cost
Run Optimization#
We use the Nelder-Mead algorithm to evolve the parameters from the healthy state to the disease state.
print("\nStarting PH Optimization...")
x0 = interface.get_initial_guess()
bounds = interface.get_bounds()
iteration_counter[0] = 0
maxiter = 20 if os.getenv("CI") else 1000 # Limit iterations for CI environments
result = minimize(
    cost_function,
    x0,
    method='Nelder-Mead',
    bounds=Bounds([b[0] for b in bounds], [b[1] for b in bounds]),
    options={'maxiter': maxiter, 'xatol': 1e-4, 'disp': True}
)

print("\nOptimization Complete!")
Starting PH Optimization...
Iter   0 | Cost: 11.8653 | SV: 58.4
    RV: 35/6 mmHg (Target 60/10)
Iter  10 | Cost: 11.3143 | SV: 57.8
    RV: 35/6 mmHg (Target 60/10)
Iter  20 | Cost: 9.4731 | SV: 57.4
    RV: 37/7 mmHg (Target 60/10)
Iter  30 | Cost: 4.3301 | SV: 53.8
    RV: 44/9 mmHg (Target 60/10)
Optimization Complete!
/tmp/ipykernel_2224/1547368076.py:6: RuntimeWarning: Maximum number of iterations has been exceeded.
  result = minimize(
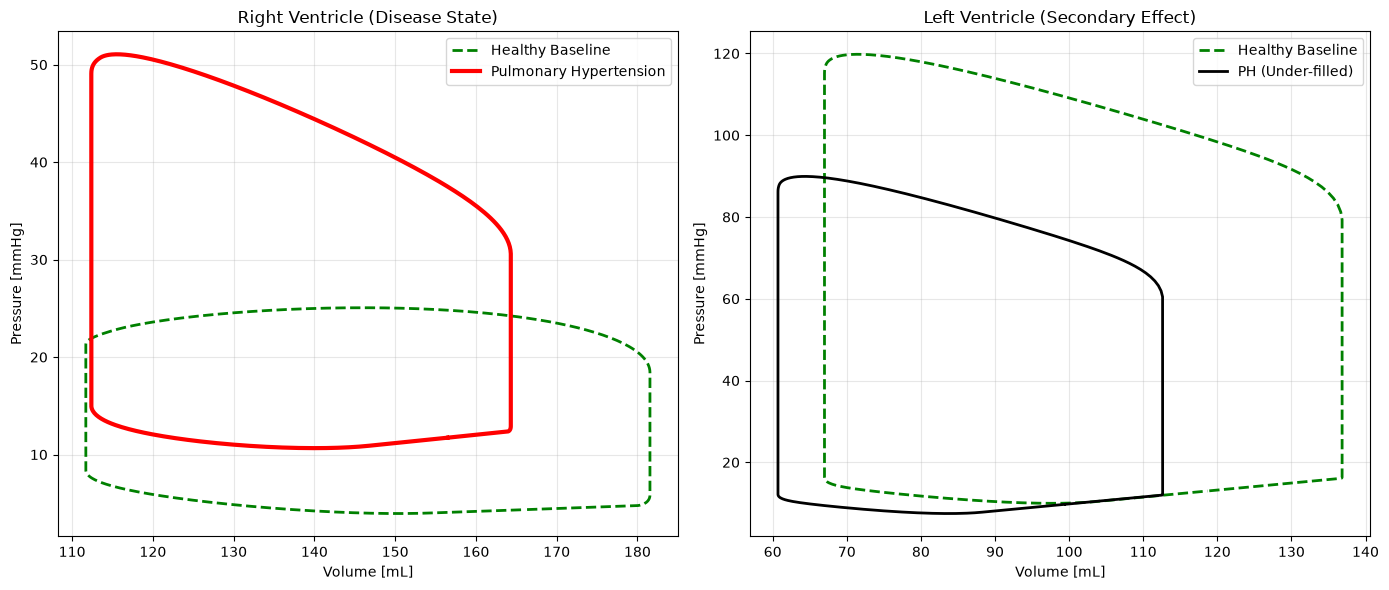
Visualization: Healthy vs. Disease#
The plot below compares the Healthy Baseline (Green) with the optimized Pulmonary Hypertension (Red).
Notice how the Right Ventricle loop shoots upward, indicating massive pressure generation. Conversely, the Left Ventricle loop shrinks slightly and shifts left, indicating it is under-filled and pumping less blood, despite being “healthy” itself.
# 1. Get Optimized PH Model
ph_params, ph_init = interface.update_model(result.x)
ph_model = Regazzoni2020(parameters=ph_params, initial_state=ph_init, add_units=False)
logging.getLogger('circulation.base').setLevel(logging.WARNING)
ph_hist = ph_model.solve(num_beats=20, dt=1e-3)

# 2. Get Healthy Baseline Model
healthy_model = Regazzoni2020(add_units=False) # Uses defaults
healthy_hist = healthy_model.solve(num_beats=20, dt=1e-3)

# 3. Plot
samples = int((1/ph_params["HR"]) / 1e-3)
slc = slice(-samples, None)

fig, axs = plt.subplots(1, 2, figsize=(14, 6))

# RV Loop (The main event)
axs[0].plot(healthy_hist["V_RV"][slc], healthy_hist["p_RV"][slc], 'g--', lw=2, label="Healthy Baseline")
axs[0].plot(ph_hist["V_RV"][slc], ph_hist["p_RV"][slc], 'r-', lw=3, label="Pulmonary Hypertension")
axs[0].set_title("Right Ventricle (Disease State)")
axs[0].set_xlabel("Volume [mL]")
axs[0].set_ylabel("Pressure [mmHg]")
axs[0].legend()
axs[0].grid(True, alpha=0.3)

# LV Loop (The consequence)
axs[1].plot(healthy_hist["V_LV"][slc], healthy_hist["p_LV"][slc], 'g--', lw=2, label="Healthy Baseline")
axs[1].plot(ph_hist["V_LV"][slc], ph_hist["p_LV"][slc], 'k-', lw=2, label="PH (Under-filled)")
axs[1].set_title("Left Ventricle (Secondary Effect)")
axs[1].set_xlabel("Volume [mL]")
axs[1].set_ylabel("Pressure [mmHg]")
axs[1].legend()
axs[1].grid(True, alpha=0.3)

plt.tight_layout()
plt.show()
Parameter Changes#
Finally, let’s look at the “Remodeling Factor.” This table shows exactly how much the parameters had to change from the healthy baseline to create this disease state. A factor of 1.0x means no change; 5.0x means a 5-fold increase.
print("\nParameter Remodeling (Factor of Healthy Baseline):")
print(f"{'Parameter':<25} | {'Healthy':<10} | {'Disease':<10} | {'Factor':<10}")
print("-" * 65)

for i, (key, _, _, _, scale) in enumerate(interface.config):
    if "OFFSET" in key: continue

    new_val = result.x[i] * scale
    factor = new_val / scale
    print(f"{key:<25} | {scale:<10.4f} | {new_val:<10.4f} | {factor:<10.2f}x")
Parameter Remodeling (Factor of Healthy Baseline):
Parameter                 | Healthy    | Disease    | Factor
-----------------------------------------------------------------
circulation.PUL.R_AR      | 0.0460     | 0.4387     | 9.54      x
circulation.PUL.C_AR      | 20.0000    | 2.0278     | 0.10      x
chambers.RV.EA            | 0.2000     | 0.4363     | 2.18      x
chambers.RV.EB            | 0.0290     | 0.0836     | 2.88      x
circulation.SYS.R_AR      | 0.7330     | 0.5864     | 0.80      x